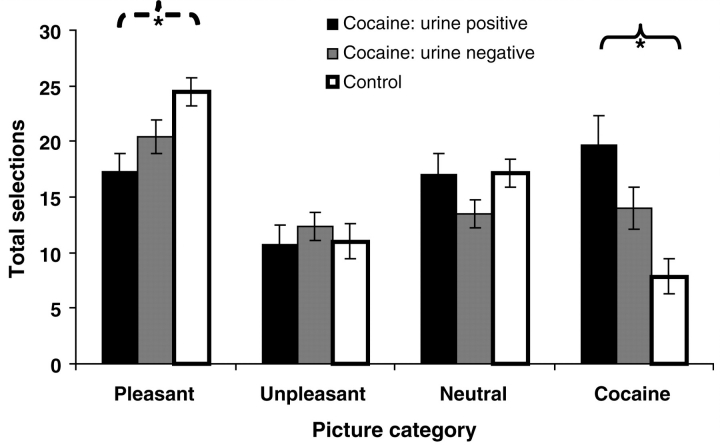
Figure 2.
Results of the probabilistic task, showing total picture selections for each of the four picture categories (pleasant, unpleasant, neutral, cocaine) for urine positive cocaine subjects (n = 16), urine negative cocaine subjects (n = 26) and healthy controls (n = 23). Significant linear contrasts for both cocaine selections (urine positive > urine negative > control) and pleasant selections (urine positive < urine negative < control) are flagged with asterisks (cocaine selections: solid brackets; pleasant selections: dashed brackets) (P < 0.05). Error bars represent standard error of the mean. Here we only flag the significant linear contrasts, which directly pertain to our a priori hypotheses; a complete listing of all significant between- and within-group comparisons, as well as means and standard deviations for each study group, can be found in Supplementary Table 1.

