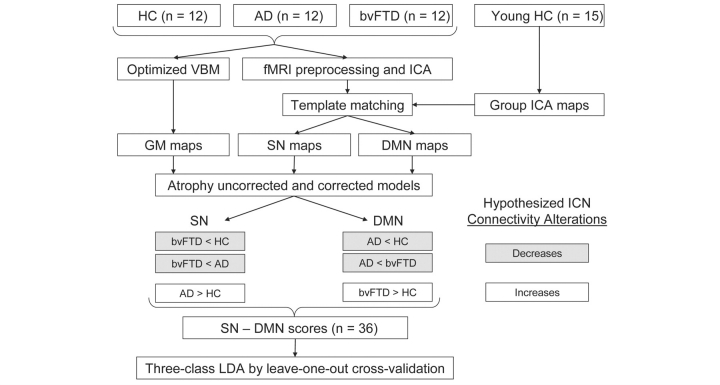
Figure 1.
Study design schematic. Preprocessed task-free fMRI data were decomposed using ICA, and Salience Network (SN) and DMN components were identified for each subject by calculating goodness-of-fit to network templates derived from an independent dataset of young healthy controls. Grey matter maps were also derived from structural MRI data of each subject for atrophy correction. Hypotheses regarding between-group connectivity alterations were tested using the linear contrasts shown. SN and DMN scores and the combined SN minus DMN index for each subject were derived and entered into three-class linear discriminant analyses. HC = healthy controls; AD = Alzheimer’s disease; VBM = voxel-based morphometry; LDA = linear discriminant analysis.

