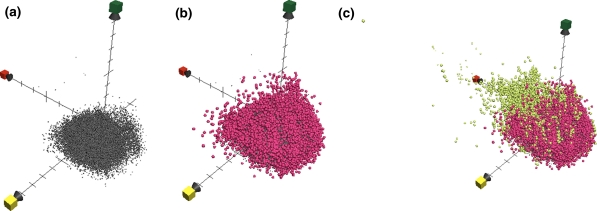
Fig. 7.
Comparison of chemical space plots (three subfigures) comparing chemical space coverage from three datasets, a 49,554 compounds screened in the pyruvate kinase assay [grey], b 20,434 compounds from the ZINC-NP subset [magenta], and c 178,210 compounds from WOMBAT 2007.1 corresponding to substances with demonstrated biological activity [lime]. Red axis = PC1, corresponding to size parameters, yellow axis = PC2, corresponding to aromaticity and conjugation related parameters, and green axis = PC3, corresponding mainly to lipophilicity. Figure by Anders Backlund, all predictions scores calculated using ChemGPS-NPweb, plotted using Apple MacOS X bundled software Grapher 2.1

