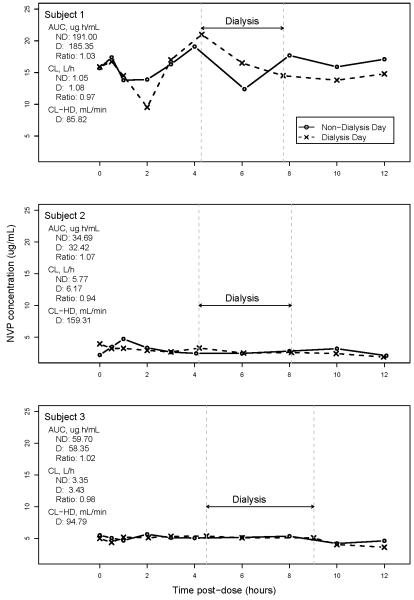
Figure 1.
Plots of plasma NVP concentration (μg/mL) by time (hr) on nondialysis (solid line, circles) and dialysis (dashed line, x-marks) days. Dashed vertical lines show start and stop times of hemodialysis. AUC, area under the NVP concentration-time curve, plasma, 0-12 hr; ND, nondialysis day; D, dialysis day; CL, systemic NVP clearance; CL-HD, hemodialysis clearance.

