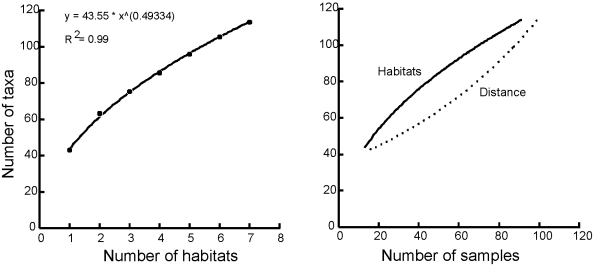
Figure 3. Species accumulation curves by (a) habitats and (b) area.
(a) The observed number of taxa (based on Mao-Tau) accumulated over habitats are represented by dots and the curve that best fits the dots by a solid line and equation. (b) Species accumulation curves based on habitats and spatially contiguous samples show different shaped curves. Samples are 7 cm diam. cores, 10 cm depth.

