
Figure 4. Cell area plotted as a function of number of neighbors for different division rules.

Cell areas are normalized such that the average cell area – including all cells of the tissue – is equal to unity. Presented data is average values together with standard deviations. The diagonal line is the relationship: 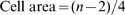 , where
  is number of neighbors, defining Lewis' law [7].