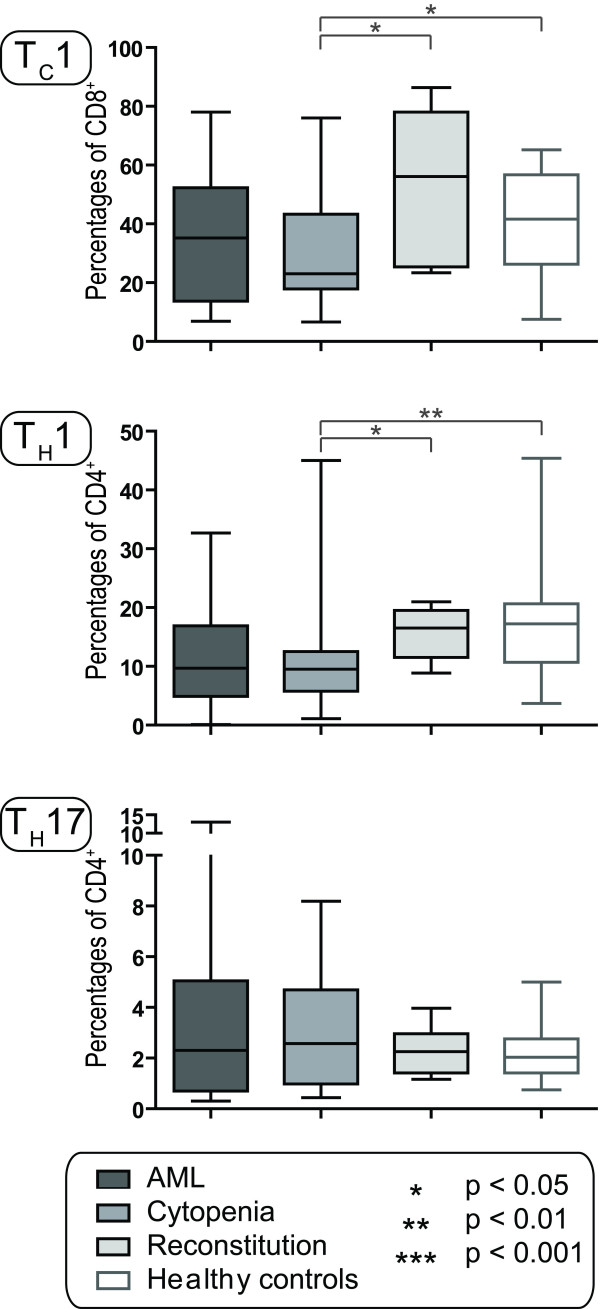
Figure 3.
The TC1, TH1 and TH17 subsets in AML patients and healthy controls. The levels of circulating TC1, TH1 and TH17 cells were investigated for patients with untreated AML (AML, n = 16), patients with chemotherapy-induced cytopenia (Cytopenia, n = 16; the first cohort of patients) and during hematopoietic reconstitution after chemotherapy (Reconstitution, n = 6); these results were compared with healthy controls (n = 30). The levels for each of the subsets are presented as the percentage of each cell type among the parent population; i.e. TC1 cells among CD8+ cells, TH1 and TH17 cells among CD8- T cells and TREG cells among CD4+ T cells. All results are presented as median (horizontal line), 25th to 75th percentiles (boxes) and variation range (whiskers). The percentages of total T cells or T cell subsets did not show any age-dependent variation among the healthy controls. Statistically significant differences are presented at the top of the figure (Mann-Whitney test).

