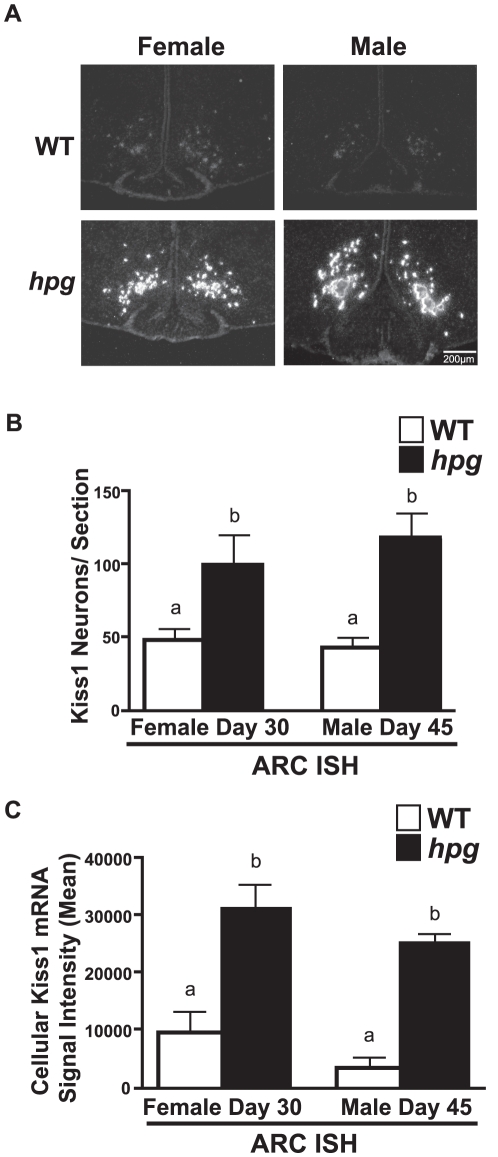
Figure 5. Kiss1 expression is increased in the ARC of female and male hpg mice.
A) Representative dark-field images of silver grain Kiss1 mRNA signal as measured by ISH in the ARC of pubertal-aged WT and hpg females (30 days) and males (45 days). Scale bar = 200 µm. B) Male and female Kiss1 positive neurons/section in the hpg ARC compared to WT. C) Mean of representative Kiss1 mRNA silver grain signal per neuron in the male and female hpg ARC sections compared to WT (mean signal intensity). Values are mean ± SEM. WT, white bars; hpg, black bars. Different letters denote significant differences, P<0.05.

