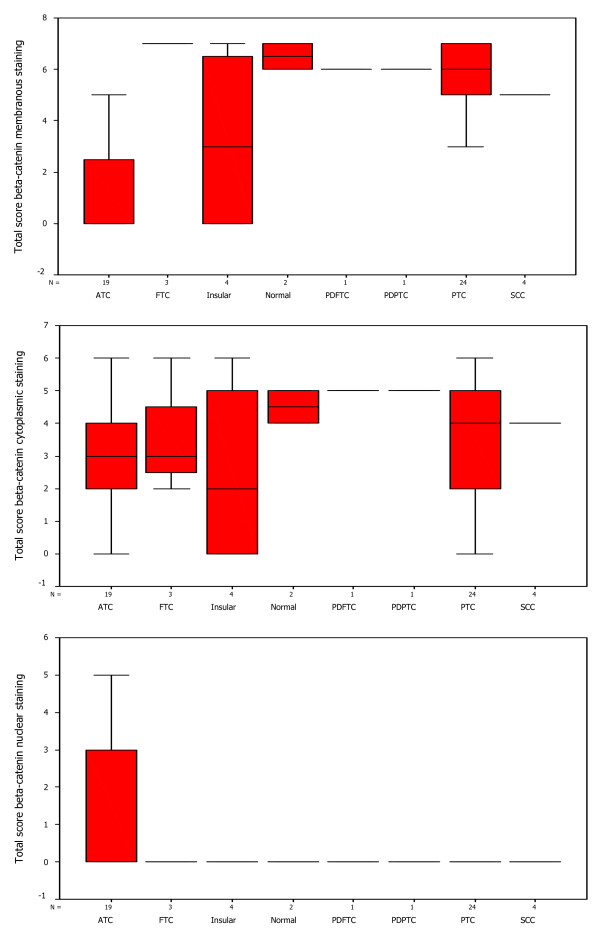
Figure 5.
Box-Plot analysis of β-catenin expression in thyroid cancers. The upper panel shows box plots for membranous β-catenin staining in ATC only. The middle panel shows cytoplasmic β-catenin in all the subtypes of TC analyzed. The lower panel shows nuclear β-catenin in normal tissues and all the subtypes of TC analyzed except most of the ATCs.

