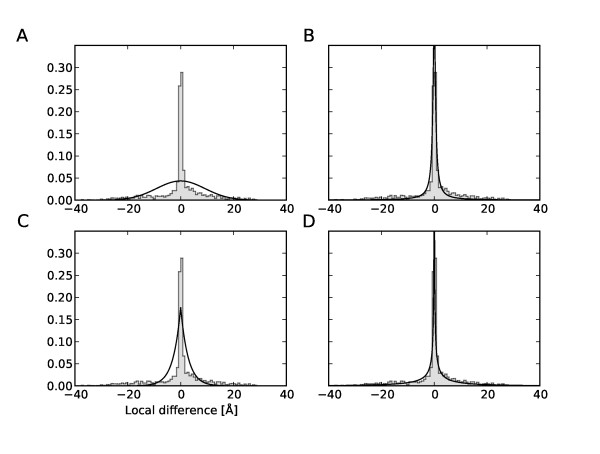
Figure 5.
Distribution of local deviations between conformational states of GroEL. Pooled distribution of local structural differences in all three spatial directions between the bound and unbound state of GroEL (1AON and 1OEL) is shown as grey histogram. Black solid lines are fits of a Gaussian (A), Student t (B), Laplace (C) and K distribution (D).

