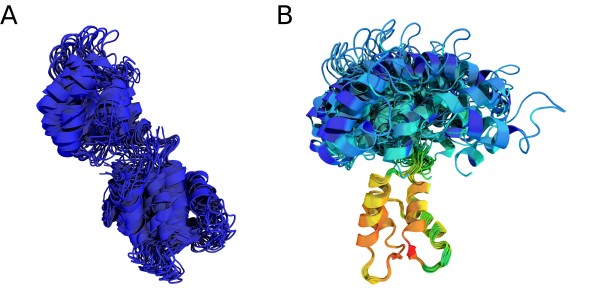
Figure 8.
Superposition of an NMR ensemble of Calmodulin. All conformations are superimposed onto the estimated average structure by the EM algorithm using a Gaussian (A) and a Student t (B) model. The superposition according to the K distribution is visually not distinguishable from the one of the Student t distribution and thus not shown. Large local scales are shown in red, whereas blue indicates small weights.

