Figure 3.
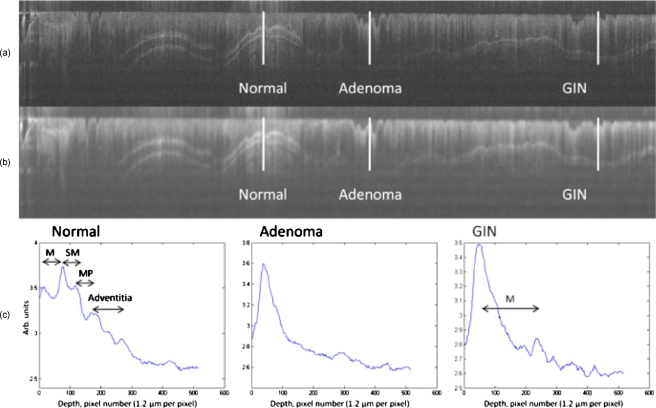
OCT imaging of mouse colon clearly distinguished normal from diseased tissue. (a) A 22×1.5 mm logged OCT image of AOM-treated mouse colon. (b) The same OCT image after median filtering with a large (21×21 pixel, 125×25 μm) kernel. (c) Plots corresponding to the logged backscattered intensity as a function of depth. The position and length of the plots are indicated by the white lines in the OCT images labeled “Normal,” “Adenoma,” and “GIN.” Anatomical features are indicated on the Normal and GIN plots. In both plots, the mucosal (M) surface and mucosa (M)/submucosa (SM) boundary are visible. The Normal plot also clearly shows the boundaries between the submucosa (SM), muscularis propria (MP), and adventitia. Because of mucosal thickening and heightened attenuation with depth, these boundaries are not visible in the GIN. The adenoma displays no clearly discernable boundaries. Note also the marked mucosal thickening between the normal and GIN tissues.

