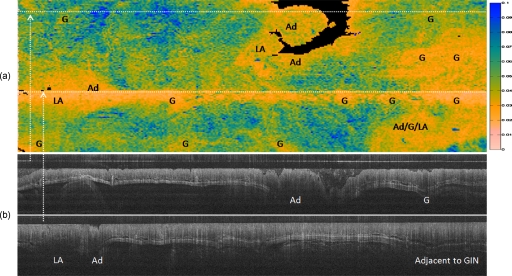
Figure 5.
(a) Two-dimensional representation (“disease map”) of the mouse colon, 20 mm long in which left is rostral and right is caudal, and in which the top and bottom wrap around to complete the cylindrically shaped colon ∼6 mm in circumference. The metric plotted is the slope standard deviation, ranging from 0 (diseased) to 0.1 (normal) arbitrary units. Locations of adenomas (Ad), GINs (G), and LA, verified both in OCT and histology, are labeled. Note that the white (pink online) areas, which indicate a low slope standard deviation or “disease,” correspond with the locations of adenomas, GINs, and lymphoid aggregates. Although lymphoid aggregates are considered confounders for disease in OCT, note the colocalization of lymphoid aggregates and adenomas, which is typical in the AOM-treated mouse model. Dark gray (blue online) areas indicate high slope standard deviation or “normal.” Black areas indicate that the colon surface fell below the minimum depth, 0.2 mm, from the endoscope window and could not be classified. The logged OCT images (20 mm long by 0.3 mm deep) at the bottom were taken at locations indicated by the dotted lines in the “disease map” at the top. (Color online only.)

