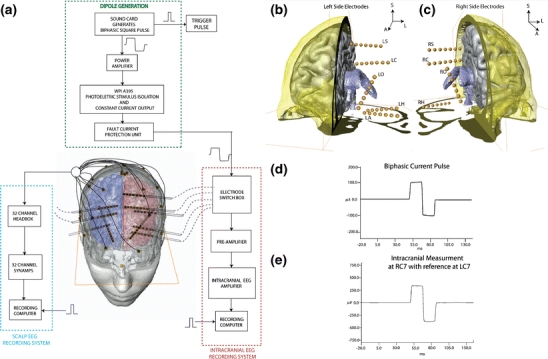
Fig. 1.

Experimental set-up. (a) Overall schematic shows the dipole generation set-up and the intracranial potential recording set-up. (b) Anterior view showing left side electrodes in subject BI18 with respect to the ventricles (colored in blue), right cortex (in gray) and cross-section of skull (O: Orbito-frontal, C: Cingulate, S: Supplementary Motor, A: Amygdala, H: Hippocampus). (C) Anterior view of right side electrodes. (d) Sample injected current pulse shows 100 μA biphasic current pulse with a upslope setting of 25 to compensate for “droop” (e) shows a sample waveform measured from contact number 7 on intracranial depth electrode RC (Right Cingulate)
