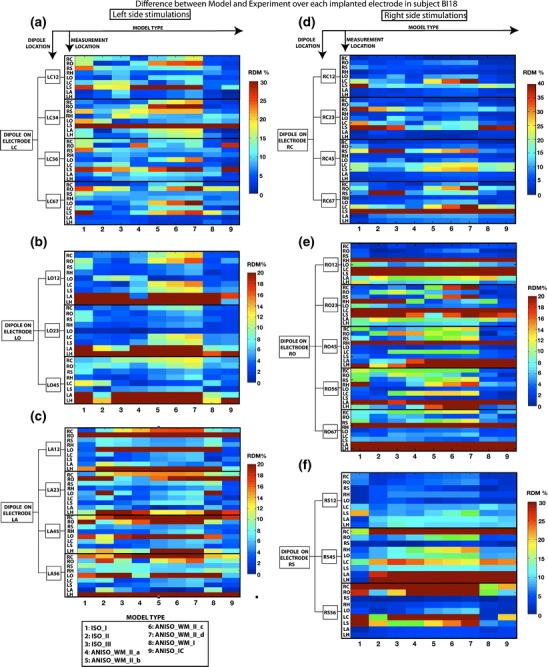
Fig. 3.

Intracranial distribution of accuracy of different models. Accuracy (RDM) of different models (columns 1-9) from each stimulation bipolar pair (indicated in boxes on the left of the graphs), to the average across the 7 contacts of each recording electrode (indicated as rows), are shown for subject BI18. (a, b, c): RDM’s for stimulation locations in the left side of the brain on electrodes LC, LO and LA, respectively. (d, e, f) The RDM’s for right sided stimulation on electrodes RC, RO and RS, respectively. These data are the same as those shown in Figure 2(b), except that RDM of responses recorded in different electrodes are presented separately here, while they are calculated over all recorded electrodes for each dipole in Figure 2(b). Individual data for subjects BI14, BI15 and BI17 are shown in Supplementary Figure 2
