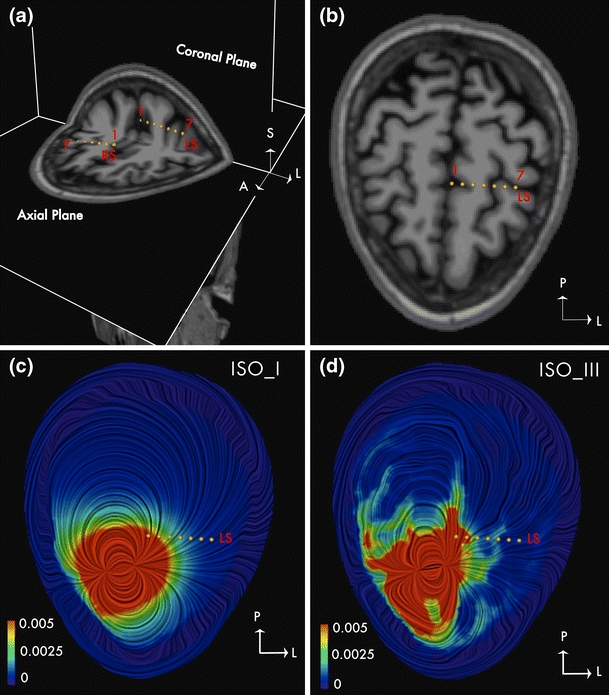
Fig. 4.

Influence of CSF on the volume currents. The electric current density vector in an axial section is shown using LIC technique for a dipole at RS12 in subject BI18. The image is color coded with the magnitude of the current density vector and the direction is indicated by the texture. (a) Electrodes LS and RS are shown on coronal and axial T1-weighted MR images. Contact numbers 1 and 7 are marked. (b) Electrode LS shown on an axial T1-MRI scan; Contact numbers 1 and 7 are marked. (c) Current density in ISO_I: 3-tissue model shown in an axial plane containing electrode LS. (d) Current density in ISO_III: 15-tissue model shown in an axial plane containing electrode LS. Influence of CSF can be seen from the increased current density in regions containing CSF in ISO_III. Magnitude of the current density is in
