
Figure 2.
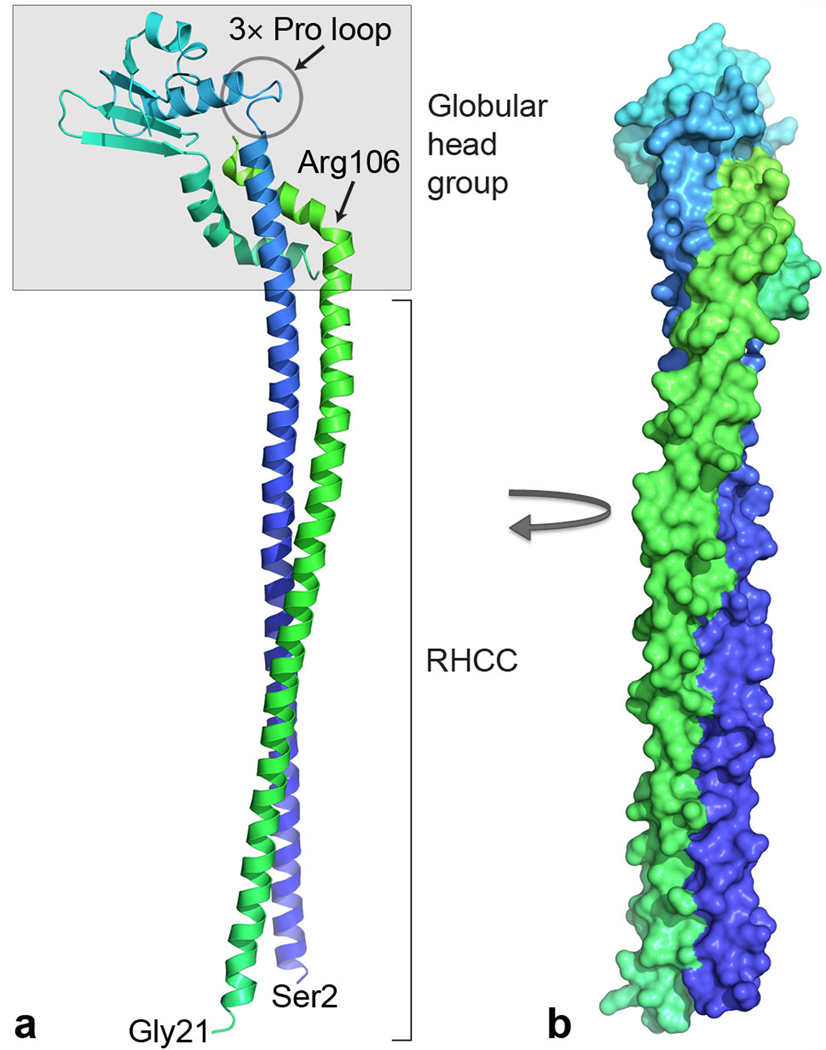
Structure of the EG peripheral stalk complex. (a) Ribbon representation with subunit E (blue to cyan) from N to C terminus and subunit G (green). The C termini of both subunits are shaded in gray and form a globular head group, whereas the N-terminal helices form an RHCC. These domains are tethered via flexible loops, one containing three proline residues (3× Pro loop) in subunit E and the other consisting of a kink at Arg106 in subunit G. Bottom, N-terminal residues of subunits E (Ser2) and G (Gly21). (b) Surface representation of the complex rotated clockwise by 90° (same colors as in a).