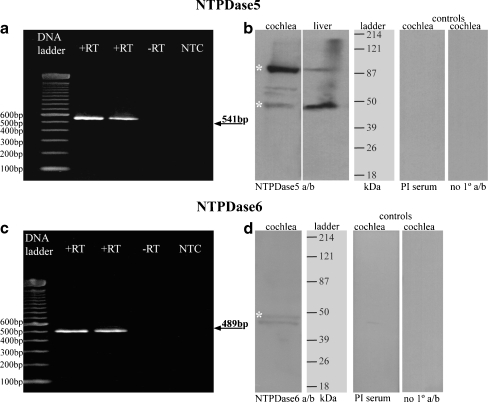
Fig. 1.
NTPDase5 and NTPDase6 expression in rat cochlear tissues. RT-PCR generated amplicons (SYBR Safe™ agarose gel) are of expected size for both NTPDase5 at 541 bp (a) and NTPDase6 at 489 bp (c), compared with a 100 bp DNA ladder. No bands are observed in control lanes, −RT reverse transcriptase omitted) and NTC (no template control). DNA sequencing verified the identity of amplified cDNAs. Immunoblots with non-reduced total cochlear protein and liver tissues show major bands around 95 and 47 kDa for NTPDase5 (b). Lower molecular weight band is consistent with the monomeric NTPDase5 isoform, whereas bands at higher molecular weight probably represent dimerized form of NTPDase5. These bands were absent from the pre-immune (PI) and no primary antibody controls. NTPDase6 antibody demonstrated a double-band pattern (46–49 kDa) in the cochlea (d)

