Fig. 1.
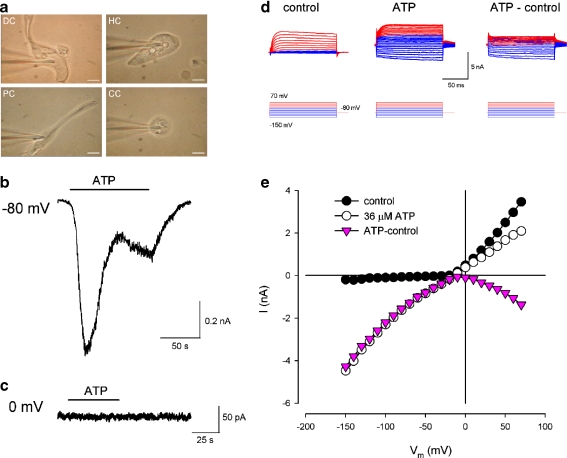
Cochlear supporting cells and ATP-evoked inward current. a Micrographs of isolated single cochlear supporting cell and patch clamp recording. DC Deiters’ cell, HC Hensen cell, PC pillar cell, CC Claudius cell. Scale bars, 10 μm. b, c Current traces evoked by ATP in a Deiters’ cell. The cell membrane potential was clamped at −80 mV (b) and 0 mV (c). The horizontal bars represent the application of 36 µM ATP. d, e Evoked currents in a Deiters’ cell for voltage step stimulation. Red and blue colors represent current responses to the positive and negative voltage step stimuli, respectively. The current–voltage (I–V) relations were plotted by average values of the steady-state currents in last 20 ms of the voltage step stimulation. Pink color represents the I–V curve of the subtracted inward current evoked by ATP

