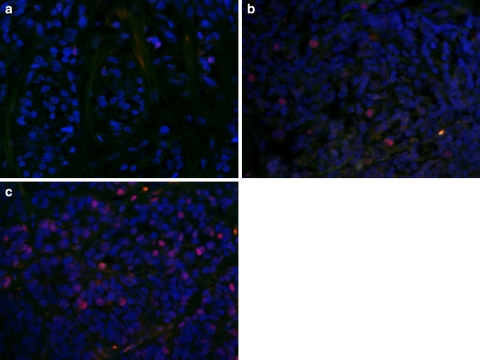
Fig. 1.
Micrographs showing cyclin D3 expression (dim red nuclear immunofluorescence) in common nevus (a), dysplastic nevus (b), and melanoma (c). Note weak signals emitted by three nuclei in common nevus and gradually increasing number of immunopositive nuclei in dysplastic nevus and melanoma. DAPI counterstaining of cell nuclei, bright orange nonspecific fluorescence of red blood cells. Original magnification ×400

