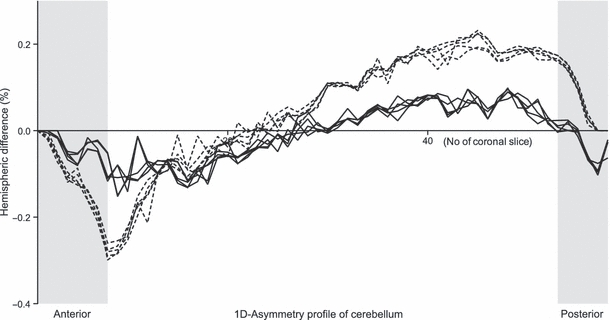
Fig. 4.

Asymmetry profile along the anterior-posterior axis. Each point represents the difference between right and left hemispheric volume at a single coronal slice, relative to total cerebellar volume in percent (ie. [slice volume (right hemisphere) - slice volume (left hemisphere)] / total cerebellar volume * 100. The gray areas refer to the slices that were excluded from the imposed variability requirement. (continuous line: right-hander, broken line: left-hander).
