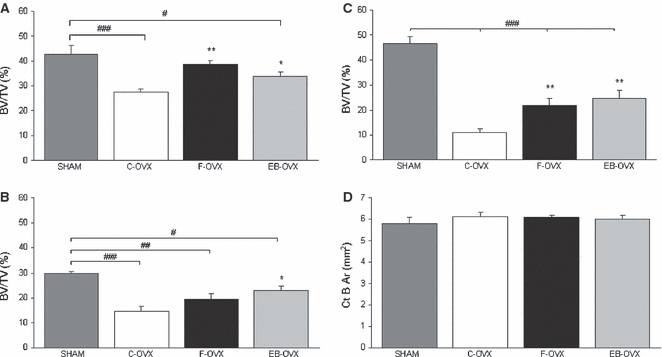
Fig. 5.

Mean values of histomorphometric parameters, expressed as BV/TV (%) and Ct-B-Ar (mm2), in both trabecular and cortical bone of the four animal groups after 60 days of treatment. (A) Sagittal section of the 4th lumbar vertebra; (B) transversal section of the 5th lumbar vertebra; (C) sagittal section of the distal epiphysis of femur; (D) transversal section at the mid-diaphyseal level of femur. Values are expressed as mean ± SEM. *P< 0.05, **P< 0.01 vs. C-OVX; #P< 0.05, ##P< 0.01, ###P< 0.001 vs. SHAM (anova followed by Newman–Keuls test). SHAM, sham-operated controls receiving vehicle; C-OVX, ovariectomized controls receiving vehicle; F-OVX, ovariectomized treated with ferutinin; EB-OVX, ovariectomized treated with estradiol benzoate.
