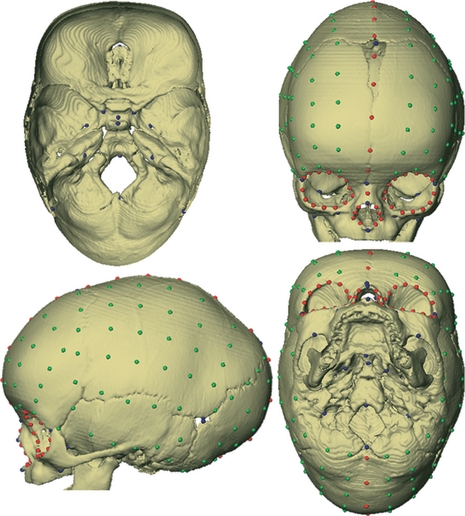
Fig. 3.

Illustration of the 222 points measured on 3D reconstruction of computed tomography scans of each individual in our sample. Anatomical landmarks (Table 2) are shown in blue, curve semilandmarks are shown in red, and surface semilandmarks are shown in green. Top left: endocranial surface of the cranial base, top right: anterior view, bottom left: lateral view, bottom right: inferior view.
