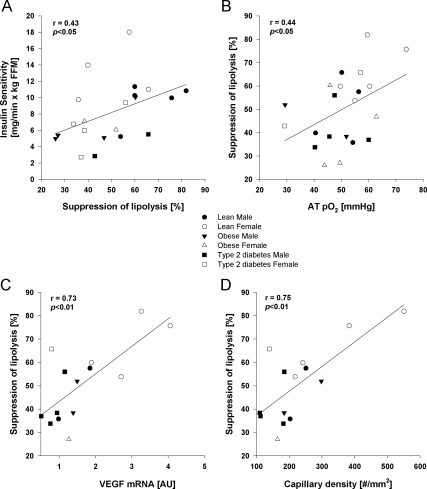
Figure 1.
Pearson correlation between suppression of lipolysis and insulin sensitivity for glucose disposal (A); AT oxygenation, ATpO2 (B); VEGF (C); and capillary density by image analysis (D). Males are represented by squares and females by circles: white for lean, gray for obese without type 2 diabetes, and black for obese with type 2 diabetes. AU, Arbitrary units.

