Figure 1.
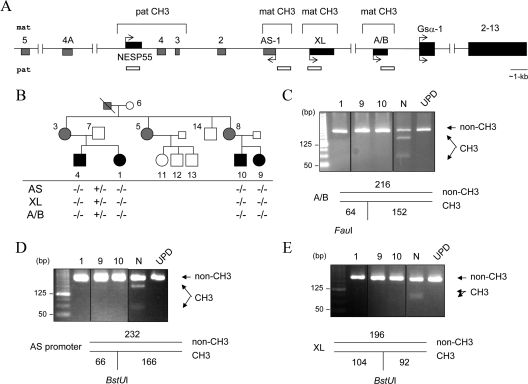
The novel AD-PHP-Ib kindred and GNAS methylation status. Panel A, Schematic representation of the GNAS locus. Maternal (mat) and paternal (pat) alleles and DMRs are indicated. Boxes and connecting lines represent exons and introns, respectively; exons of the antisense (AS) transcripts are in gray. Arrows indicate the direction and parental origin of transcription. White horizontal bars indicate the regions analyzed for methylation. Panel B, The AD-PHP-Ib kindred and the GNAS methylation status. White, black, and gray symbols indicate unaffected, affected, and unaffected carriers, respectively. The presence (+) or absence (−) of methylation was determined by COBRA. Results for individuals 1, 9, and 10, as well as a normal control (N) and a patient with patUPD20q (UPD) are shown in panels C (exon A/B), D (antisense promoter), and E (exon XL). The size of each amplicon and the digestion products are depicted below the images of ethidium bromide-stained agarose gels; non-CH3 is the product derived from the nonmethylated allele, and CH3 is the product from the methylated allele. All samples for a given product were analyzed within the same experiment and digestion products were separated on the same gel; vertical black lines indicate intervening lanes with unrelated samples, which were digitally removed; some images are overexposed to ensure the presence or the absence of digestion products.

