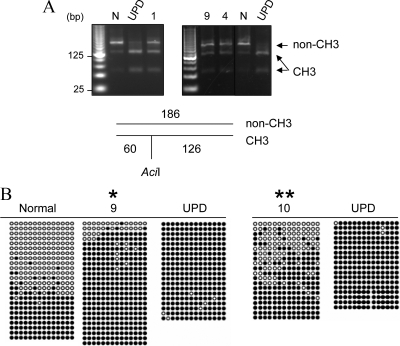
Figure 2.
Methylation analysis of the NESP55 DMR. A, Results of COBRA are shown for individuals 1, 9, and 4, as well as a normal control (N) and a patient with patUPD20q (UPD). The size of the amplicon and the AciI digestion products are depicted below the gel image; non-CH3 is the product derived from the nonmethylated allele, and CH3 is the product from the methylated allele. Samples investigated at the same time are separated on the same gel; the vertical line in the image on the left indicates intervening lanes with unrelated samples, which were digitally removed. B, Each row of circles represents cloned amplicons from bisulfite-treated genomic DNA of individual 7 or 9 or the individual with patUPD20q (UPD). In a separate experiment, the analysis was also performed by using DNA from individual 10 and patUPD20q. Black circles represent methylated CpG; white circles represent nonmethylated CpG. The segment for the methylation analysis is indicated in Fig. 1A. Significantly different from normal (*, for individual 9) or UPD (**, for individual 10) according to Fisher’s exact test (P < 0.05; two-tailed).

