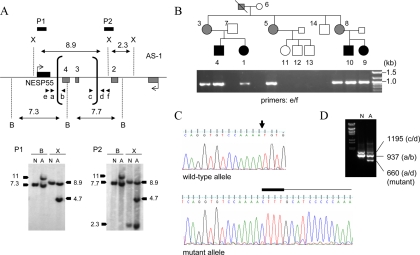
Figure 3.
Identification and analysis of the novel GNAS deletion causing AD-PHP-Ib. Panel A, Southern blot analysis of genomic DNA from a normal control (N) and the affected individual 9 (A), indicating the novel antisense deletion. Horizontal bars represent locations of the probes P1 and P2; vertical brackets, deletion break points (determined precisely by PCR shown in panel B); arrowheads, primers used for the amplification of the deleted allele; B, BamHI; X, XmnI. Note that the slight size differences between the wild-type hybridizing bands from the normal and the affected individual reflect a gel running artifact due possibly to differences in the salt concentration. Panel B, PCR amplification of the deleted allele using primers located upstream and downstream of the deletion breakpoints. Pedigree is shown above the ethidium bromide-stained agarose gel showing the amplicons. White, black, and gray symbols indicate unaffected, affected, and unaffected carriers, respectively. The expected wild-type product of approximately 5 kb did not amplify, and hence an approximately 1-kb band is seen in all the individuals of this AD-PHP-Ib kindred who are heterozygous for the deletion. Panel C, Nucleotide sequence analysis of the PCR products derived from the mutant allele. In the wild-type sequence, the deletion site is indicated by an arrow. In the mutant sequence, the CTTT insertion and the sequence from the telomeric end of the deletion are indicated above the sequence chromatogram by thick and thin horizontal lines, respectively. Panel D, Duplex PCR amplification of the wild-type and deleted alleles by using primer pairs at each of the deletion breakpoints (arrowheads in panel A).

