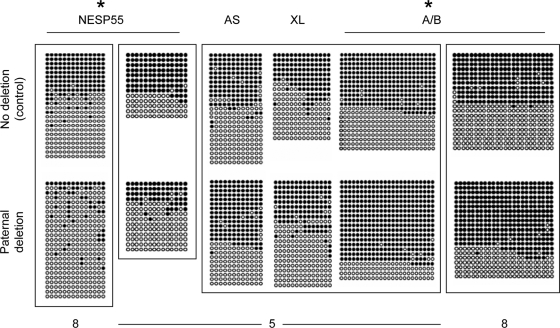
Figure 6.
Methylation analysis of GNAS DMRs using DNA from healthy controls (no deletion; upper panels) and from individuals with paternal inheritance of delAS3–4 (paternal deletion; lower panels). Amplicons obtained from bisulfite-modified genomic DNA were cloned and sequenced. Results are shown for individual 7, who has no deletion, and individuals 5 (NESP55, AS, XL, and A/B) or 8 (NESP55, A/B), who have paternal deletions. DNA samples that were bisulfite treated in the same experiment are placed in the same frame. Each row of circles represents a single clone containing multiple CpG dinucleotides; nonmethylated CpG (white circles); methylated CpG (black circles). *, Pooled data from the analyzed unaffected carriers are significantly different from no deletion controls according to Fisher’s exact test (P < 0.05; two-tailed).

