
Figure 2.
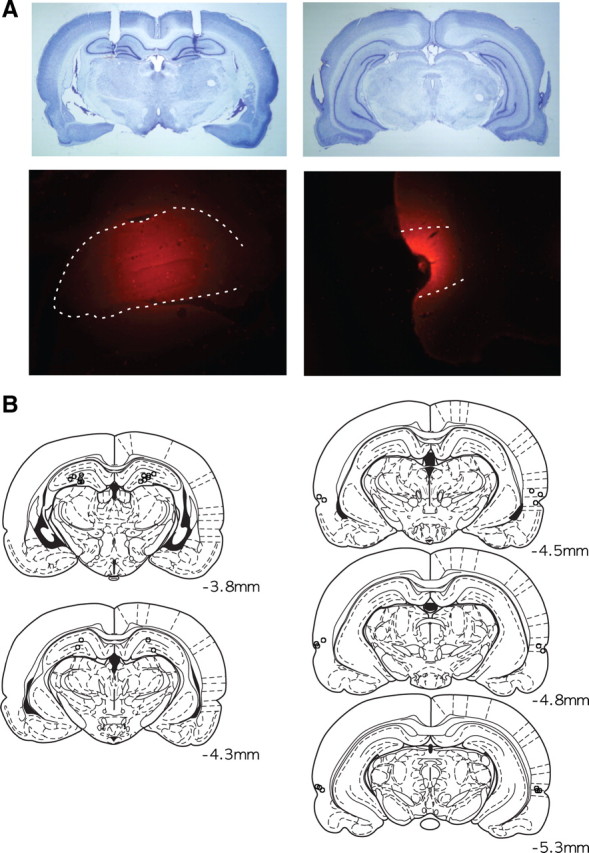
Histological verification of cannula positions and drug injection sites. A, Representative photomicrographs for cannula placement in the hippocampus (left) and PR (right). The top panel shows Nissl-stained sections, and the bottom panel displays the spread of fluorescent MUS. The dotted lines in the bottom panel show the boundaries of the hippocampus (left) and the PR (right). B, Illustration of the locations of the injection cannula tips in the hippocampus and PR in all animals used in the study. The numbers show distances from bregma.