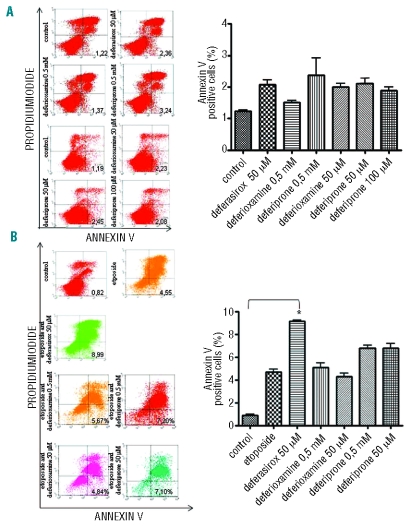
Figure 5.
Apoptosis evaluated by fluorescence-activated cell sorting for the detection of annexin V-positive K562 cells after incubation with the three chelators and with etoposide and deferasirox. The apoptotic rate, represented by the percentage of cells both positive for Annexin V and negative for propidium iodide by FACS is indicated in each graph and represented on the right. (A) The apoptotic rate is not increased with respect to basal conditions after incubation with deferioxamine and deferiprone 0.5 mM for 30 min and deferasirox 50 mM for 18 h. The same results have been obtained after deferioxamine 50 mM incubation and deferiprone 50 and 100 mM incubation for 18 h. (B) Apoptosis assay of K562 cells in control cells and after etoposide 10 mM for 72 h alone or preceded by 50 mM deferasirox incubation for 18 h. After etoposide 10 mM for 72 h incubation an increase in the apoptotic cells amount can be detected (mean value 4.68%±0.46) and this is even higher if etoposide is preceded by deferasirox 50 mM for 18 h incubation (mean value 9.13±0.2). K562 cells were also incubated with etoposide preceeded by deferioxamine and deferiprone 50 mM for 18 h and 0,5 mM for 30 min without any statistically significant increase in the apoptotic rate as shown also by the graph on the right. No changes in apoaptotic rate can be detected after deferioxamine incubation (mean 5.1±0.64 at 50 mM and 4.3±0.49 at 50 mM), whereas deferiprone induces a slight increase in apoptotic rate (mean 6.7±0.45 at 0.5 mM and 6.8±0.7 at 50 mM).

