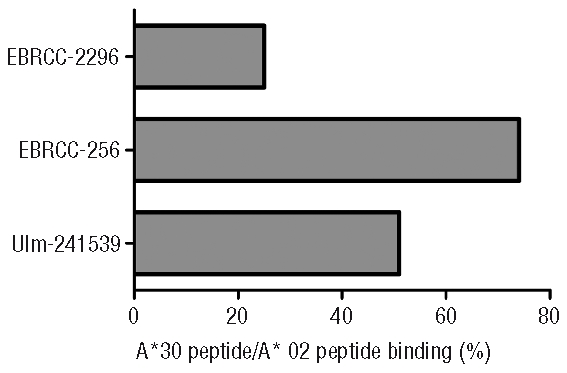
Figure 2.

Relative A*30/A*02 peptide-binding intensities for different HLA-expressing B-LCLs. The diagram shows the peptide-binding intensities of the investigated cell lines EBRCC-2296 (HLA-A*0201 homozygous), EBRCC-256 (HLA-A*0201/A*3001), Ulm-241539 (HLA-A*0201/A*3014L) achieved after acid-treatment and reconstitution using FITC-labeled A*3001/3014L-restricted (EITALAK(FITC)PSTMK) and A*0201-restricted (NLVPMK(FITC)VATV) peptides. Relative peptide-binding intensities of the HLA-A*30 lig-and compared to the HLA-A*0201 ligand were calculated for each of the three cell lines as followed: [double positive A*30 binding cells/double positive A*0201 binding cells]*100. Background expression of cells, which were cultured without the synthetic peptides, was used as the blank value.
