
Figure 2.
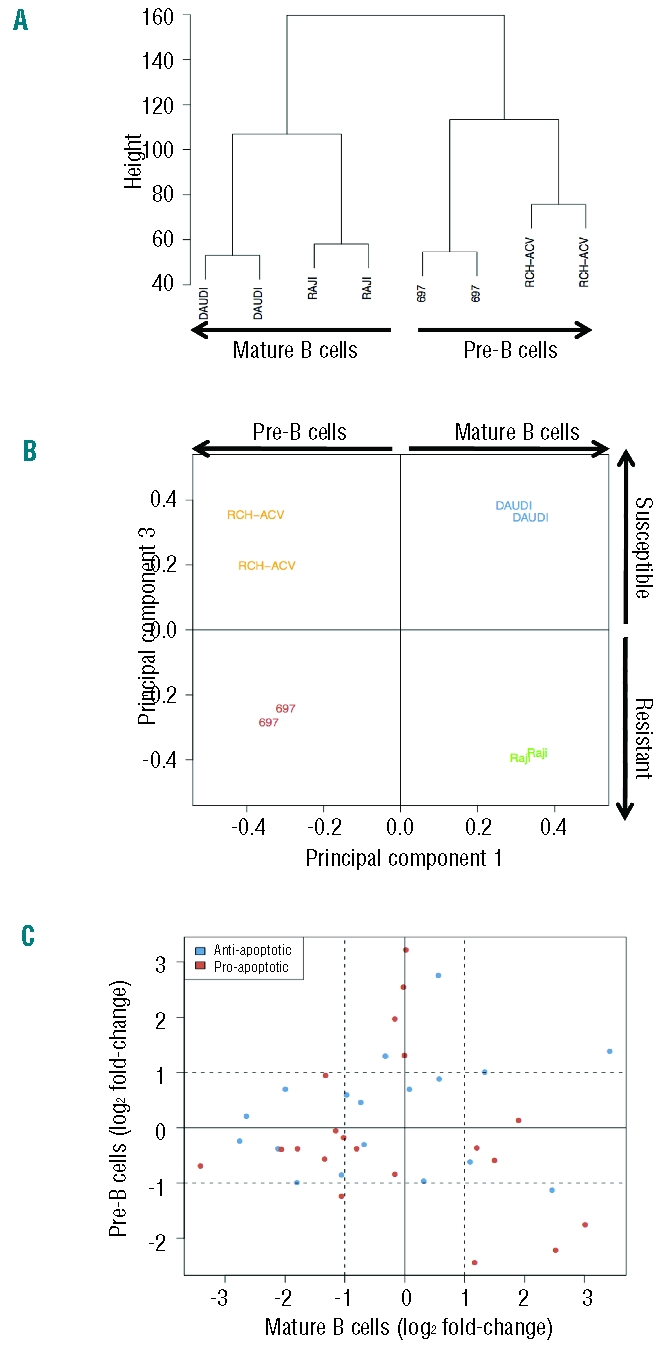
Comparison of gene expression in tumor cell lines susceptible or resistant to γδ-PBL cytotoxicity. Bioinformatics analyses of cDNA microarray comparisons between the Burkitt’s lymphomas DAUDI and RAJI; and the B-ALL lines RCH-ACV and 697. (A) Unsupervised hierarchical clustering analysis. Samples with similar gene expression patterns are grouped together and connected with branches, producing a clustering tree (or dendrogram) on which the branch length inversely reflects the degree of similarity between samples. (B) Principal Component Analysis. The samples are plotted according to the first and third principal components (corresponding to the largest variation found between samples). (C) Variations in expression levels of anti- or pro-apoptotic genes in susceptible versus resistant tumor cell lines. Dashed lines indicate 2 fold-changes (in logarithmic scale) in the expression ratio susceptible/resistant.