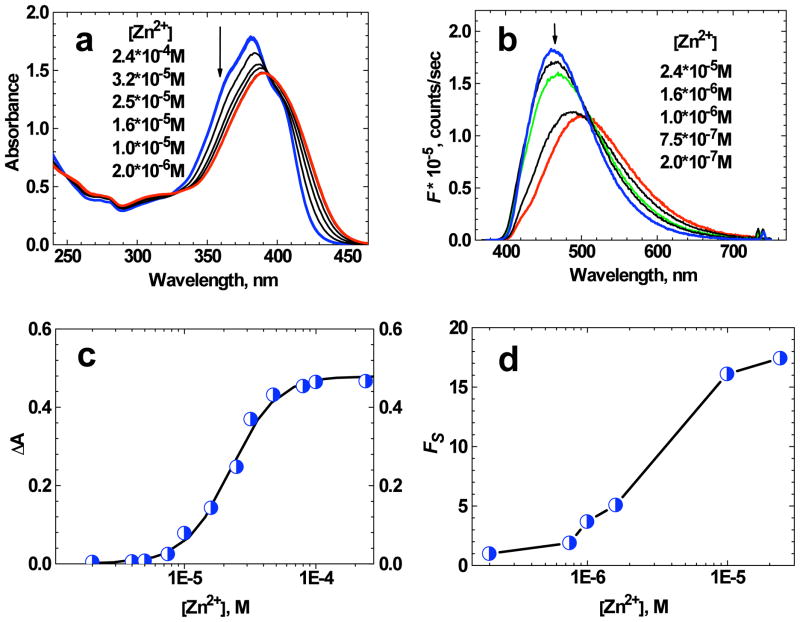
Figure 3.
(a) Absorption spectra of 1 in THF (D ≈ 2.5·10−5 M) for different values of total ion concentration [Zn2+]. (b) Fluorescence spectra of 1 in THF (D ≈ 2·10−6 M) for different values of [Zn2+] (λex = 370 nm). The arrows indicate the decrease in [Zn2+]. (c) Change in absorbance at 360 nm as a function of [Zn2+] for 1 in THF (D ≈ 2.5·10−5 M). The solid line corresponds to the best fit by eq. (3). (d) Dependence Fs = f ([Zn2+]) for 1 in THF (D ≈ 2·10−6 M). The absolute accuracy of each experimental point is ±10%.

