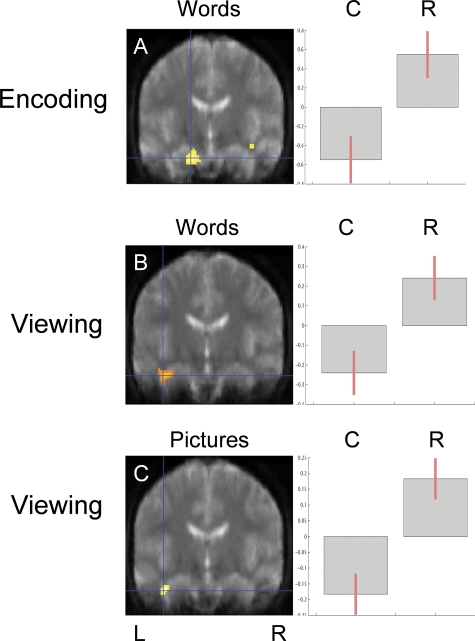
FIG. 4.
Group comparisons highlighting regions showing significant differences between right TLE patients and controls. Contrast estimates are shown on the right of the SPMs. For all graphs, controls (C) are on the left and patients (R) on the right. (A) Word encoding: greater activity in right TLE than in controls, left hippocampus. (B) Viewing words: greater activity in right TLE than in controls, left hippocampus. (C) Viewing pictures: greater activity in right TLE than in controls, left hippocampus.

