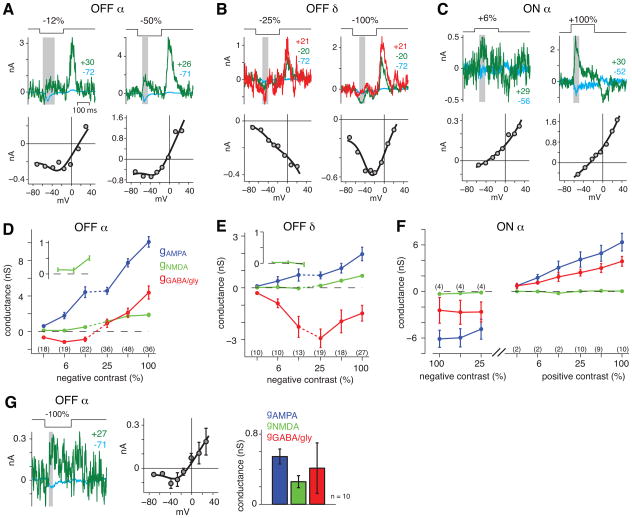
Figure 4. The NMDAR contribution to contrast coding differs between cell types.
A. Responses and I-V plots for 200-ms pulses of low or high contrast in an OFF α cell. Traces at two Vholds are shown (in mV, indicated above the traces). The fitted line was J-shaped in both cases, indicating an NMDAR contribution to the response.
B. Same format as A. for an OFF δ cell. A U-shaped function at −100% contrast reflects an NMDAR contribution.
C. Same format as A. for an ON α cell. Fitted functions are relatively linear at both low and high contrast, indicating a weak NMDAR contribution.
D. Fitted conductances as a function of contrast for OFF α cells. The stimulus size was usually 0.4-mm dia. for low contrasts (3–12%) and 0.2-mm dia. for high contrasts (25–100%). Error bars indicate SEM across cells. The number of cells recorded at each contrast is indicated below the symbols. Inset shows the NMDAR conductance at the lowest three contrasts.
E. Same format as D. for OFF δ cells.
F. Same format as D. for ON α cells. The stimulus was either negative or positive contrast, and spot diameter was always 0.5-mm.
G. OFF α cell response to a 25 x 25 μm square at high contrast (−100%) showed a J-shaped relationship in the I-V plot (error bars indicate SEM across 10 repeats in one cell). The bar graph shows a significant AMPAR and NMDAR conductance across cells (error bars indicated SEM across 10 cells).

