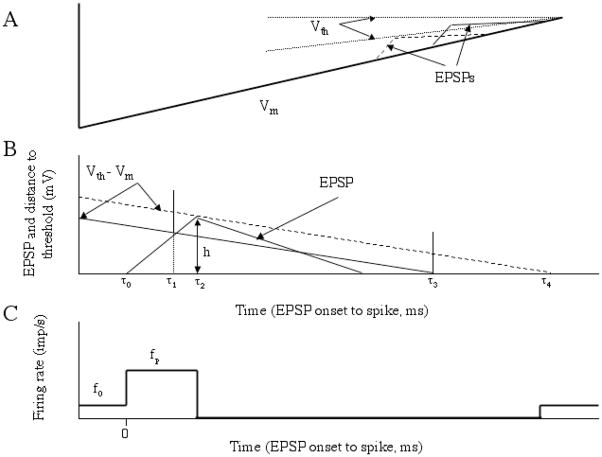
Figure 2.
A. Approximate membrane potential trajectory between spikes with superimposed EPSPs. Dotted traces indicate to different potential trajectories of spike threshold. B. Two different distance to threshold trajectories referenced to the onset of two different EPSPs. EPSPs occurring earlier in the interspike interval (dashed line) fail to advance spikes, whereas those occurring later do. C. Predicted PSTH. See text for further details. (Adapted from Fig. 11 A – C of (Fetz and Gustafsson, 1983) with permission.)

