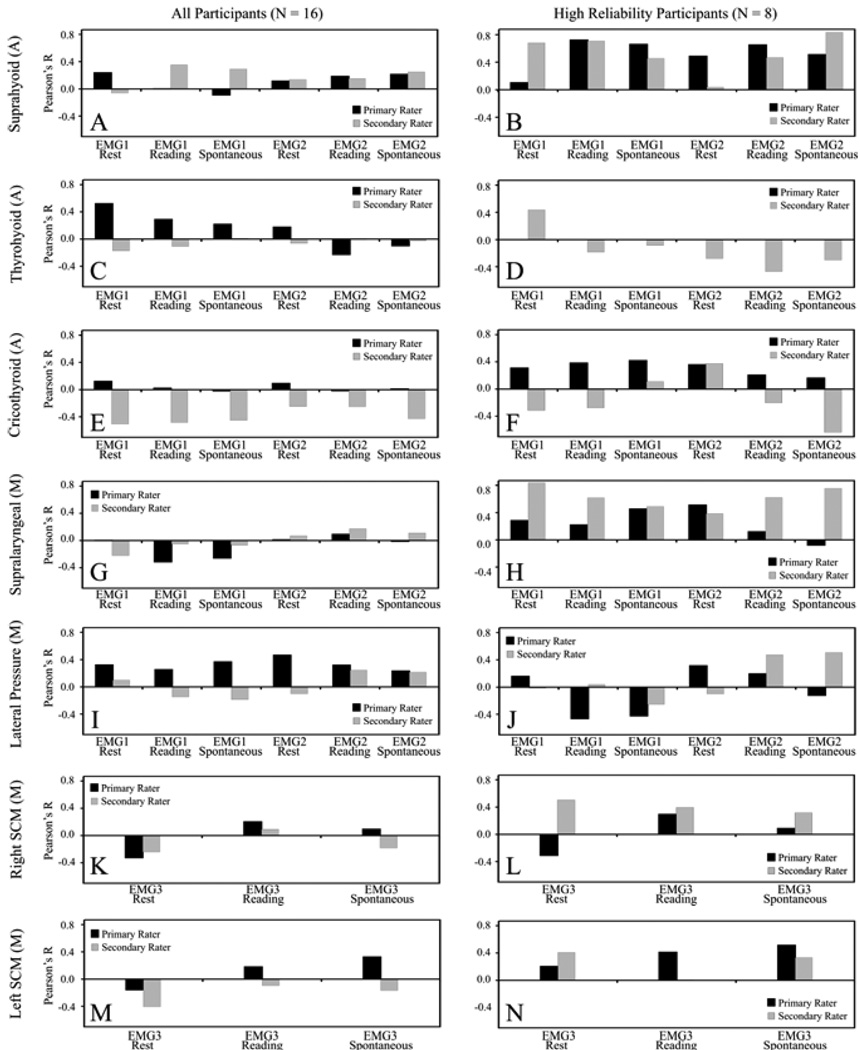
Figure 5.
Pearson’s correlations between palpation measures and sEMG. Palpation measures marked with an (A) are part of the Angsuwarangsee & Morrison system10; those marked with an (M) are part of the Mathieson et al. system.12 The left panel (A, C, E, G, I, K, M) is for the entire set of participants (N = 16); the right panel (B, D, F, H, J, L, N) is for the reduced set of “high reliability participants” (N = 8).

