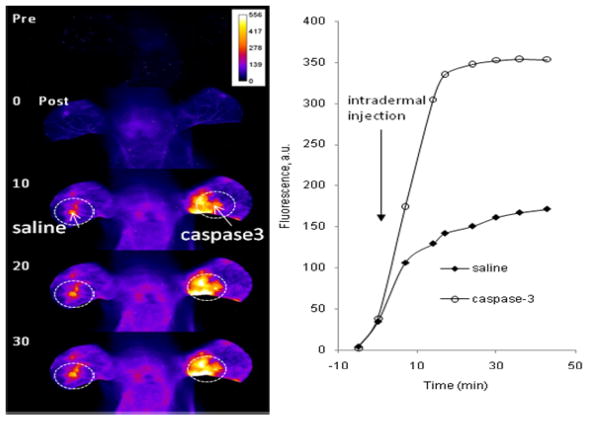
Figure 10.
Fluorescence intensity maps of mouse head and ears before (top image), immediately after (second image from top) intravenous administration of 5 and at time points after further external intradermal injection of either saline control or caspase-3 in opposite ears. Corresponding plot of fluorescence intensity over time for regions of interest drawn over the intradermal injection sites. The measured fluorescence intensity increased about more than double for the caspase-3 injection over the saline injection site and more than 3 times that of surrounding healthy tissue. Fluorescence was monitored at 805 nm at 785 nm excitation. For comparison, Caspase-3 was applied only on right ear and saline was injected in the left ear.

