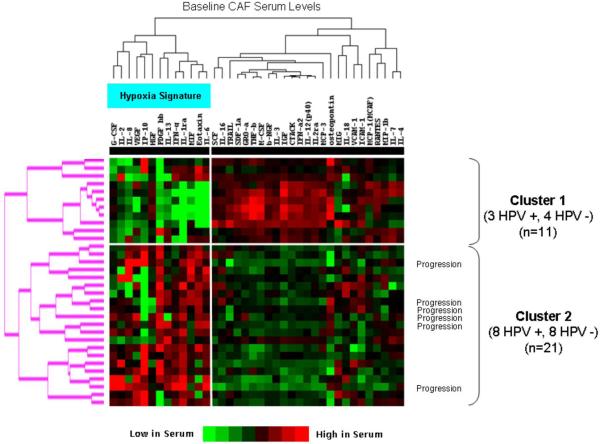
Figure 3. Unsupervised clustering identified two distinct CAF signatures that correlate with clinical outcome, but not with HPV status.
Relative serum levels of 38 baseline CAFs are shown (red indicates high protein levels, green low protein levels). Each row contains CAF levels for an individual patient. Two distinct patient CAF profiles are identified (Cluster 1 and Cluster 2), and all six patients with PD are in Cluster 2 which is characterized by higher levels of hypoxia associated factors, as indicated in the figure. There is no association between HPV status and clusters.

