
Figure 5.
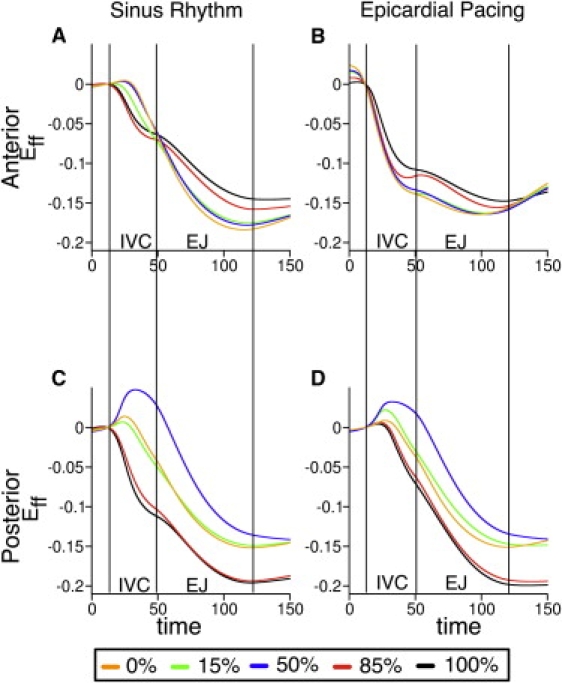
Temporal traces of fiber strain along the dashed lines in Fig. 4 (anterior and posterior walls) at different wall depths (expressed as % of wall thickness) during SR and after EP. Epicardium and endocardium correspond to 0% and 100% wall depth, respectively. IVC, isovolumic phase; EJ, ejection phase.