
Figure 3.
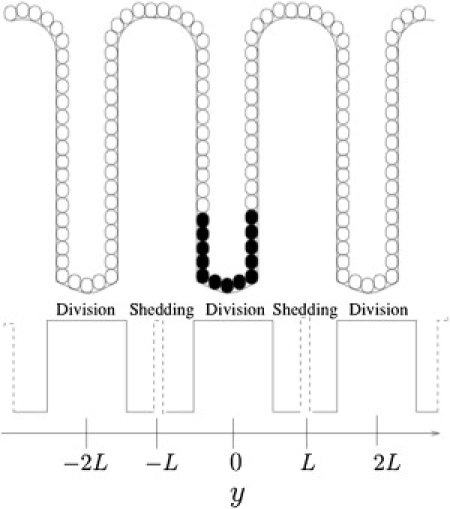
Schematic illustration of the multiple-crypt continuum model. L denotes the crypt height. Cell proliferation (solid line) occurs in regions centered around the points {…, −2L, 0, 2L, …}. Cell shedding (dashed line) occurs in regions centered around the points {…, −L, L, …}. Mutant cells (shaded) are introduced at the bottom of the central crypt.