
Figure 5.
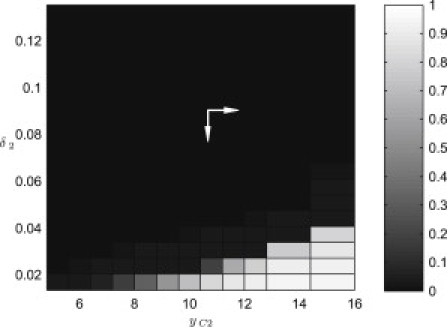
Bifurcation diagram showing the fraction of mutant cells in the neighboring crypt (centered at y = 2L) at τ = 1000 h changes as the shedding rate, δ2, and division threshold, yC2 are varied. The point (yC2, δ2) = (10, 0.09) corresponds to the position in parameter space of a wild-type cell.