
Figure 4.
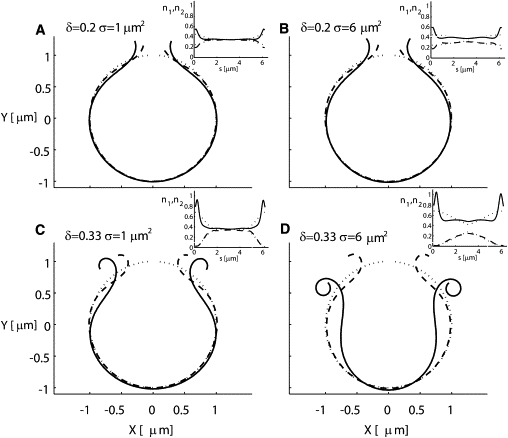
Effects of the spatial distribution of type I and type II filaments on membrane dynamics. The initial distribution has an excess of type I filaments localized at the edges of the hole, with a normal distribution of amplitude (δ) such that the density of the filaments at the edges is 0.35±δ (for type I and type II, respectively). The top and bottom rows are for δ = 0.2 [#/μm] and δ = 0.33 [#/μm], and the left and right columns are for σ = 1 [μm2] and σ = 6 [μm2], respectively. The mobility of the filaments is quite high (nsat = 100 μm−2; Λ/nsat = 10−4 gr s−1) in comparison to the low mobility in Fig. 3. Note that for the case of δ = 0.2 [#/μm] this amplitude was not sufficient to curl the membrane within the given time frame of 30 s (A and B). In addition, the case of high amplitude and low variance is not sufficient to form a complete curl. Finally, the case of high amplitude δ = 0.33 [#/μm] and high variance σ = 6 [μm2] yields a single curl within 30 s. Note that the larger variance creates a larger pool from which to attract more type I filaments toward the edges (D). In each inset, the dotted lines are the initial distribution of filaments, the dashed line is the distribution of type II filaments, and the solid line is the distribution of type I filaments. In the inset of panel D, note the large flux of filaments type I toward the edges.