
Figure 6.
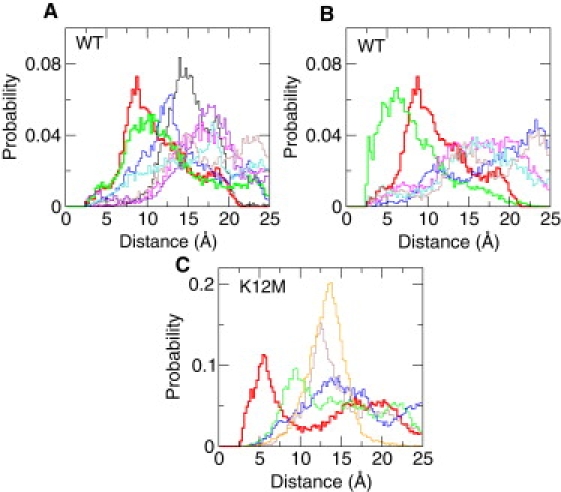
Probability distributions for attractive and repulsive interactions in the denatured states of WT and K12M NTL9 at pH 4. (A) Between Asp8 and a basic residue (except for Lys7 and Lys10) in the denatured state of WT. The distributions for Asp8-Lys12 and Asp8-Lys14 are shown in red and green, respectively. (B) Between Lys12 and an acidic residue in the denatured state of WT. The distribution for Asp8-Lys12 and Glu17-Lys12 are shown in red and green, respectively. (C) Between a pair of acidic residues in the denatured state of mutant K12M. The distribution for Asp8-Glu48 is shown in red. Histograms were made in the range between 0 to 25 Å with a bin width of 0.25 Å.