
Figure 3.
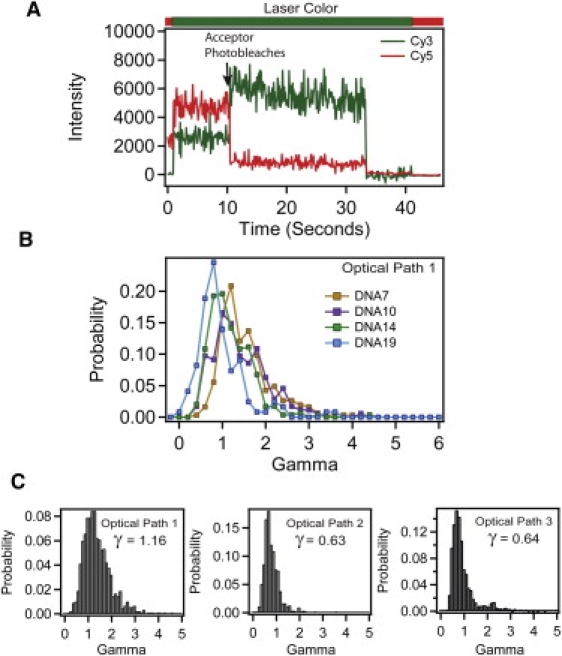
Measuring γ from anti-correlated photobleaching events. (A) Example trace (DNA10) showing a molecule from which γ can be calculated based upon the anti-correlated change in acceptor (red) and donor (green) intensity. Acceptor photobleaching is indicated with arrow. The bar above the panel shows the alternating laser colors during acquisition. The γPhotobleach can only be calculated from molecules where acceptor photobleaching precedes donor photobleaching. (B) Histogram of individual γPhotobleach values for each DNA molecule recorded under optical path 1 for DNA7 (orange), DNA10 (purple), DNA14 (green), and DNA19 (blue). (C) Cumulative histogram showing universal γPhotobleach for DNA duplexes measured under optical path 1 (left), optical path 2 (middle), and optical path 3 (right).