
Figure 5.
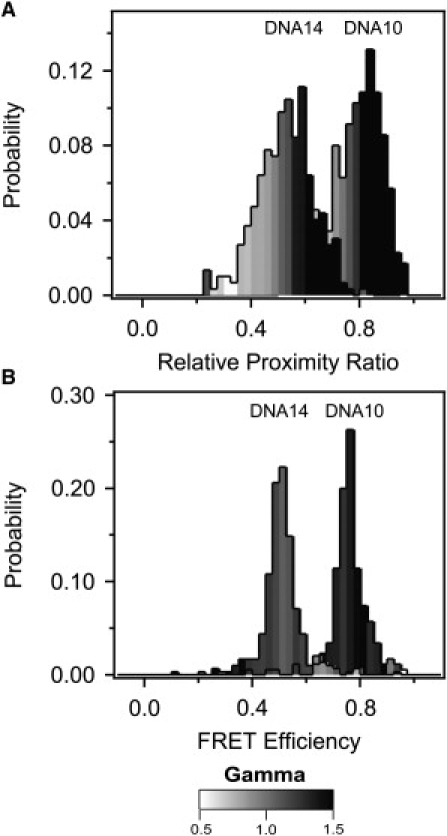
Distribution of γ within the FRET peak for DNA. (A) The mean γ-value for all molecules within each bin of the uncorrected relative proximity ratio histogram for DNA10 and DNA14 measured under optical path 1. The value of mean γ for each bin of the FRET histogram is colored according to the scale bar shown beneath the panels. An increasing relative proximity ratio correlated with increased γ for uncorrected measurements. (B) The mean γ-value for all molecules within each bin of the corrected FRET efficiency histogram for DNA10 and DNA14 after γIndividual normalization. The γ-values are more evenly distributed in the FRET histogram but γ-outliers still show outlying FRET values.