
Figure 4.
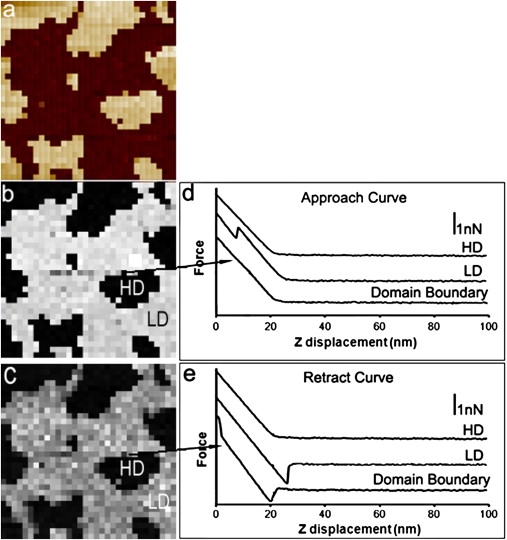
FV images at a trigger value of 4.8 nN on DOPC/DOPS/SM (1:1:2, mol/mol/mol) bilayers containing 10 mol % CHOL under HIS conditions. (a) AFM height image. Scan size: 500 × 500 nm2; height scale: 5 nm. (b) Breakthrough map created using approach-force curves such as those shown in d; force scale: 4.0 nN. (c) Adhesion map created retract-force curves such as those shown in e; force scale: 1.5 nN. Force spectra of lighter regions in the repulsive-force map (b) correspond to lower force associated with the LD, and those of black regions in b correspond to the HD shown in a. The black regions in the adhesion map (arrow in c) show induced order regions.