
Figure 2.
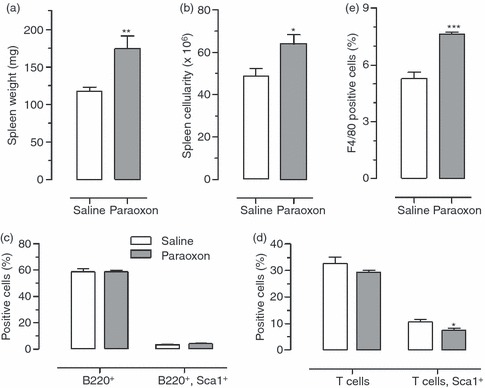
Changes in lymphoid tissue following paraoxon treatment. Following 3 weeks of exposure to saline or paraoxon, mice were analysed for changes in (a) spleen weight, (b) splenocyte count, (c) percentage of resting and activated (Sca-1+) B lymphocytes, (d) T lymphocytes and (e) splenic F4/80+ macrophages. For (a) and (b), the data represent the mean ± SEM of 20 mice per group pooled from six independent experiments. For (c–e), each bar represents the mean ± SEM of four mice per group and is representative of four independent experiments. Asterisks denote significant differences between saline and paraoxon groups (*P < 0·05; **P < 0·01; ***P < 0·001).