
Figure 2.

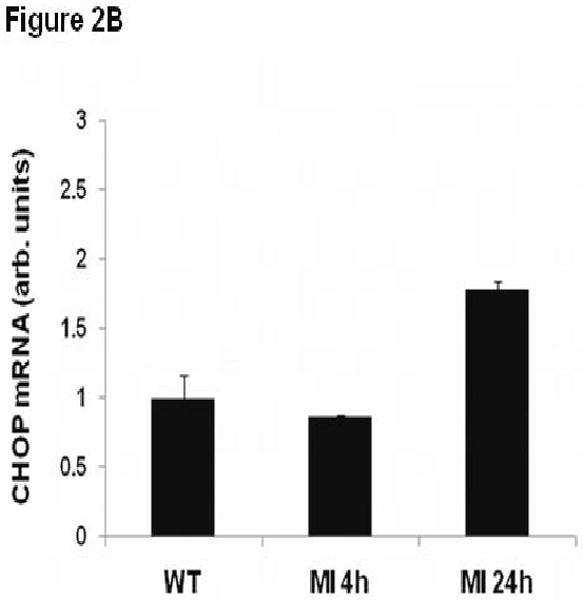


ER stress markers and TRB3 expression is induced in cardiac tissue after myocardial infarction. Wild type C57BL/6J mice were subjected to experimental myocardial infarction by ligation of the left anterior descending coronary artery. A. Total left ventricle was isolated 4 and 24 hours after MI or sham operation for RNA isolation. Quantitative real-time PCR analysis of GRP78 was performed. B. Total left ventricle was isolated 4 and 24 hours after MI or sham operation for RNA isolation. Quantitative real-time PCR analysis of CHOP was performed. C. Total left ventricle was isolated 4 and 24 hours after MI or sham operation for RNA isolation. Quantitative real-time PCR analysis of TRB3 was performed. *, P<0.05 by one way ANOVA (Holm-Sidak method) versus sham operation. D. Infarct border zone (defined as one-quarter circumference on either side of the infarct edge) and remote left ventricular tissue was isolated 24 hours after MI surgery for RNA isolation. In addition, the entire left ventricle was isolated 24 hours after a sham operation for RNA isolation. Quantitative real-time PCR analysis of TRB3 was performed. *, P<0.05 by one way ANOVA (Holm-Sidak method) versus remote left ventricle.