Figure 6.
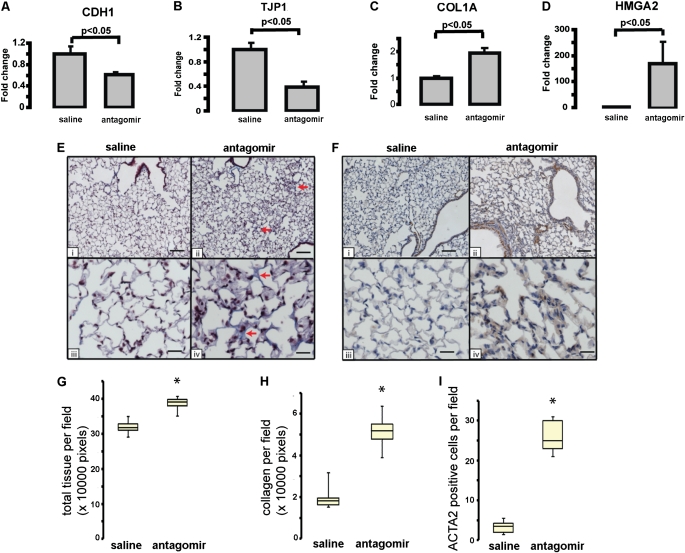
Effect of let-7 inhibition in vivo by intratracheal antagomir administration. Gene expression levels of (A) E-cadherin (CDH1), (B) tight junction protein-1 (TJP1 [ZO-1]), (C) collagen type 1A (COL1A), and (D) high-mobility group AT-hook 2 (HMGA2) levels in mice (n = 4) treated with intratracheal antagomir (10 mg/kg) or saline for 4 days. In both (E) and (F), panels i and iii are of saline-treated lungs and panels ii and iv are of antagomir-treated lungs. Scale bars: i and ii, 100 μm; iii and iv, 25 μm. (E) Masson trichrome staining after 18 days of saline or antagomir treatment. Arrows in ii and iv point to the blue staining for collagen. Note alveolar septal thickening. (F) Immunolocalization of α-smooth muscle actin (ACTA2). ACTA2 staining (brown) is significantly increased in antagomir-treated mice compared with saline-treated controls. (G) Quantitation of the total tissue in control and antagomir-treated lungs. Ten different fields (original magnification, ×20) from each slide were quantified, *P < 0.05. (H) Quantitation of collagen in control and antagomir-treated lungs. Ten different fields (original magnification, ×20) from each slide were quantified, *P < 0.05. (I) Number of ACTA2-expressing cells stained brown was significantly higher in antagomir-treated lungs in comparison with control lungs, *P < 0.05.

